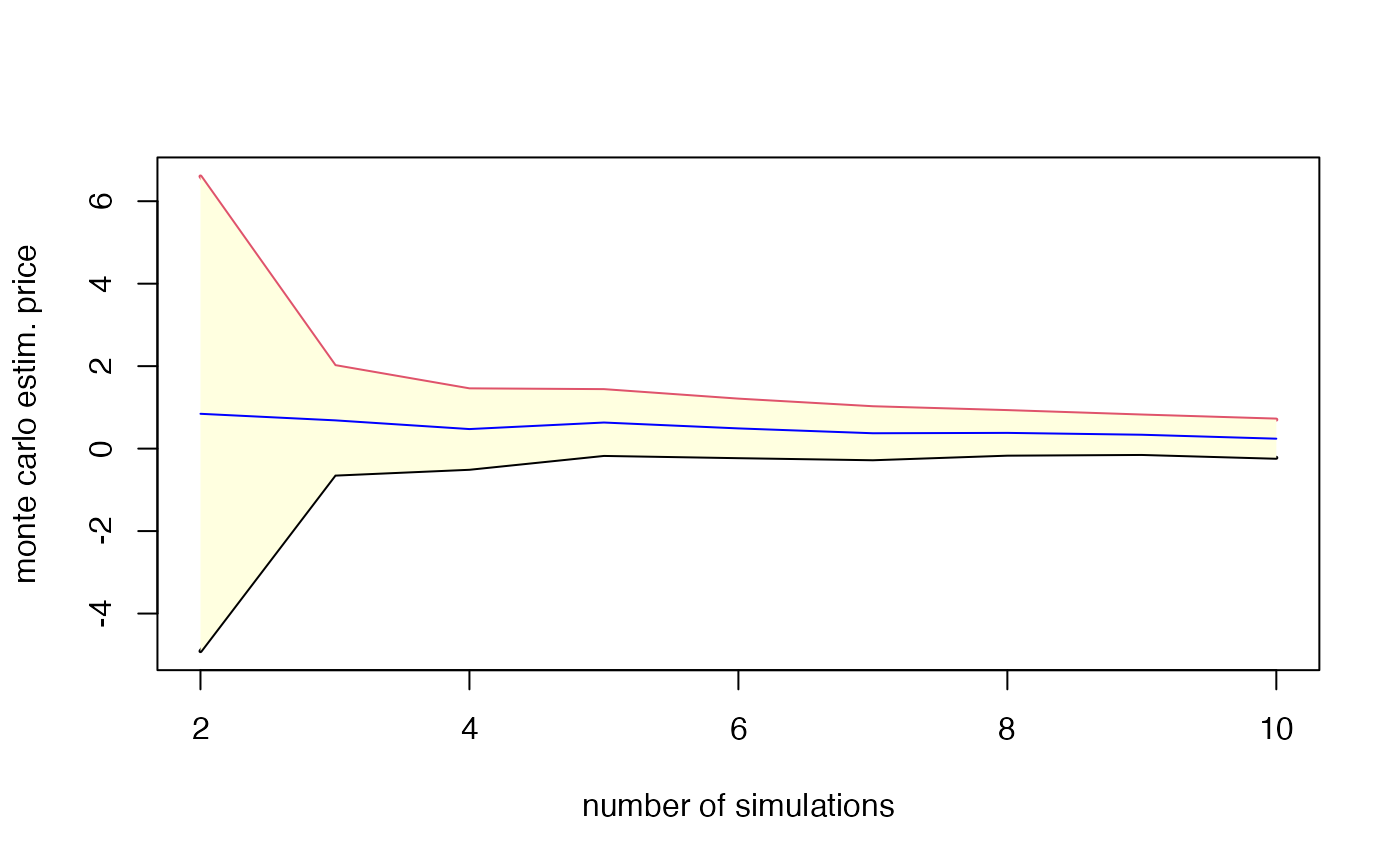
Analyzes the convergence of Monte Carlo prices by computing average prices and confidence intervals as the number of simulations increases.
esgmccv(r, X, maturity, plot = TRUE, ...)Arguments
Value
A list containing:
avg.price: Vector of average prices for different numbers of simulations
conf.int: Matrix of confidence intervals (lower and upper bounds)
Details
The function computes the average price and confidence intervals for increasing numbers of simulations to analyze the convergence of Monte Carlo estimates. It discounts the price series using the provided interest rate and evaluates at the specified maturity.
If plot=TRUE, it creates a plot showing:
Confidence intervals as shaded area
Average price as a blue line
X-axis showing number of simulations
Y-axis showing Monte Carlo estimated prices
