Model-agnostic statistical probabilistic forecasting with conditional volatility
condvolf.RdCombines a mean model and a volatility model to produce probabilistic forecasts. Uncertainty is propagated from two sources: simulated innovation draws and simulated volatility paths derived from the variance model's residuals via bootstrap.
condvolf(
  y,
  h = 10L,
  mean_model = forecast::auto.arima,
  sigma_model = forecast::auto.arima,
  innovation = c("empirical", "gaussian", "student"),
  level = 95,
  B = 1000L,
  bootstrap_vol = TRUE,
  ...
)
Arguments
- y
A numeric vector or time series of class
ts.- h
Forecasting horizon.
- mean_model
Function to fit the mean model (default:
forecast::auto.arima). Options includeforecast::auto.arima,forecast::ets,forecast::thetaf, or any custom function that returns an object withforecastmethod.- sigma_model
Function to fit the variance model on squared residuals (default:
forecast::auto.arima).- innovation
Distribution for standardized innovations. One of
"gaussian"(fastest, often sufficient),"student"(heavy-tailed), or"empirical"(non-parametric, most flexible).- level
Confidence level for prediction intervals (default: 95).
- B
Number of simulated paths (default: 2000).
- bootstrap_vol
Whether to bootstrap volatility residuals (default: TRUE). If FALSE, uses parametric normal approximation for volatility.
- ...
Additional arguments passed to
mean_modelandsigma_model.
Value
A forecast object with components:
xOriginal time series.
meanPoint forecast (mean of simulations).
lowerLower prediction interval bound.
upperUpper prediction interval bound.
levelConfidence level.
simsMatrix of simulated forecast paths (
h x B).modelList containing
meanandsigmamodel fits.residualsResiduals from the mean model.
standardized_residualsScaled standardized residuals used for innovation fitting.
methodCharacter string describing the method used.
Examples
# \donttest{
library(forecast)
# Basic usage with Google stock data
y <- fpp2::goog200
# Gaussian innovations (fastest, often sufficient)
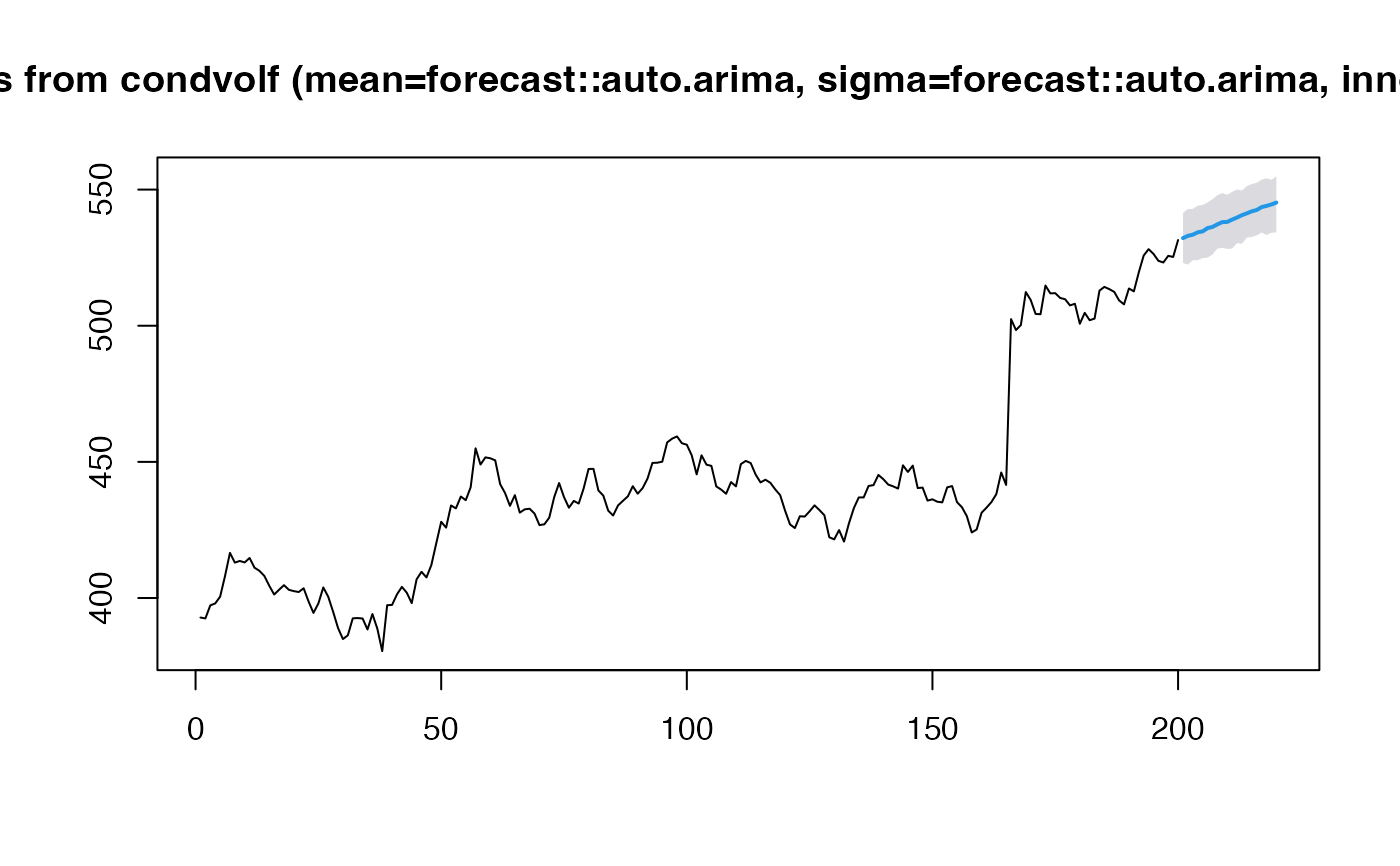
fc1 <- condvolf(y, h = 20, innovation = "gaussian")
plot(fc1)
 # Student-t innovations (heavy-tailed)
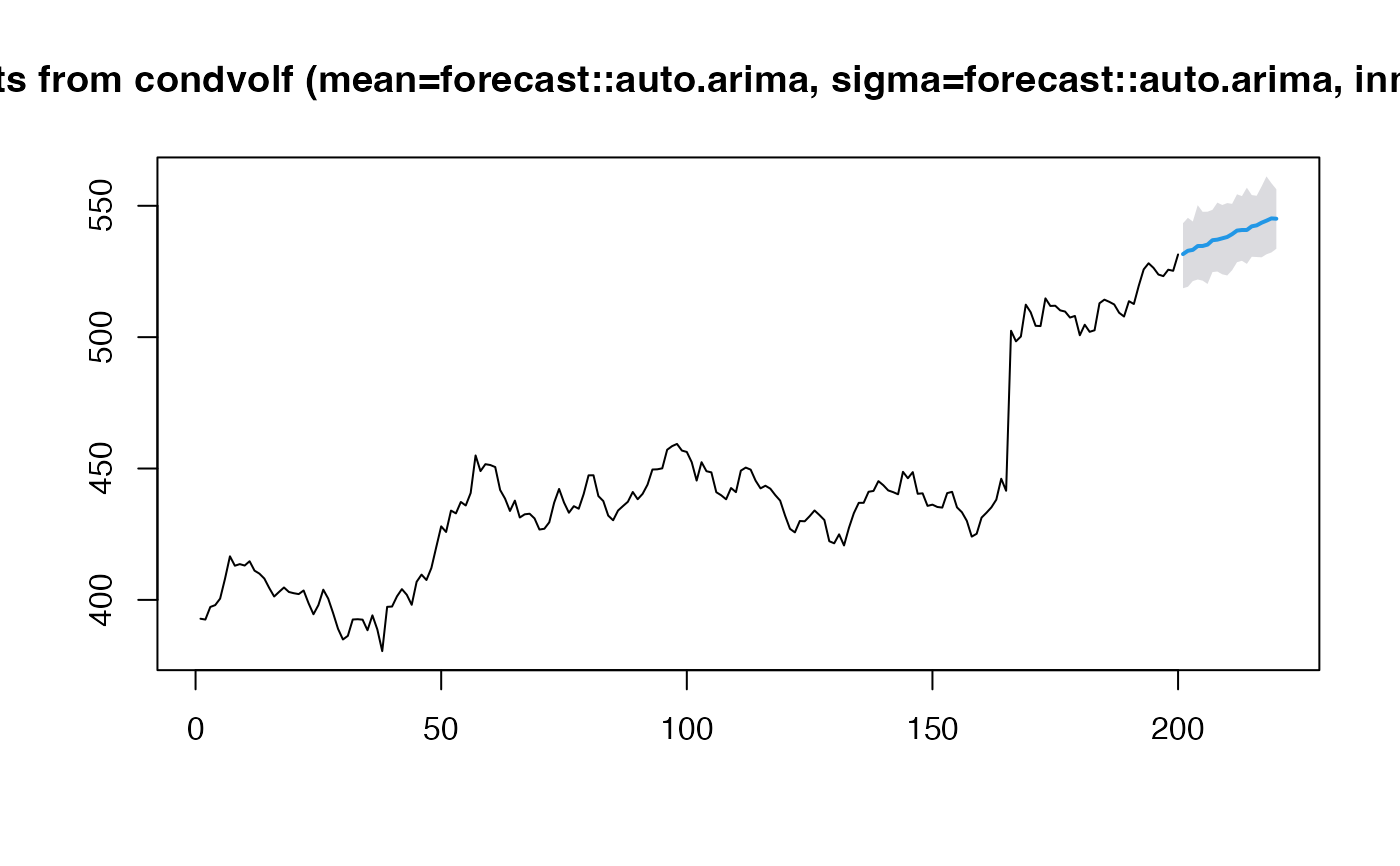
fc2 <- condvolf(y, h = 20, innovation = "student")
#> Warning: NaNs produced
plot(fc2)
 # Empirical innovations (non-parametric)
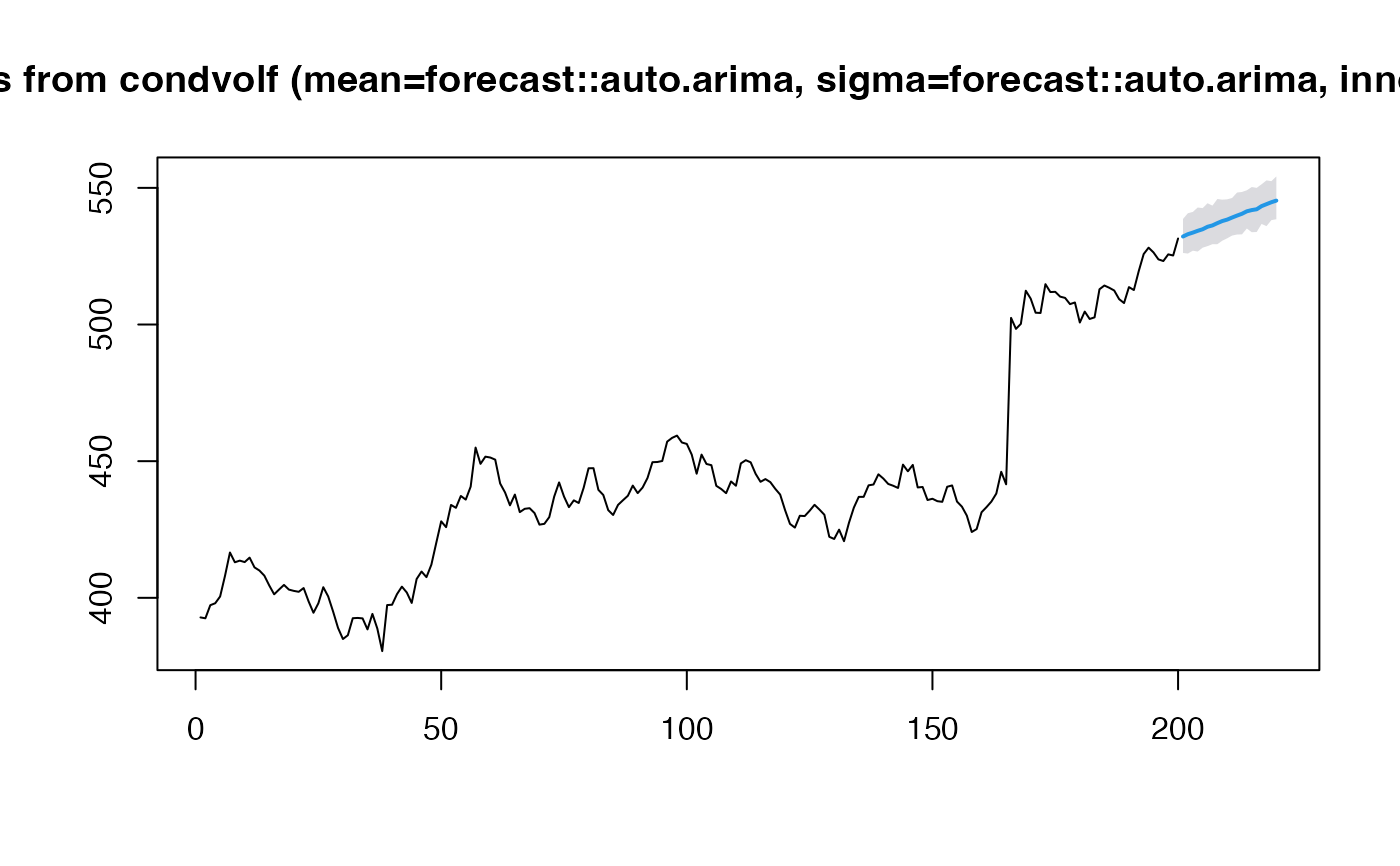
fc3 <- condvolf(y, h = 20, innovation = "empirical")
plot(fc3)
 # Using different mean and volatility models
fc4 <- condvolf(y, h = 20,
mean_model = forecast::thetaf,
sigma_model = forecast::ets,
innovation = "gaussian")
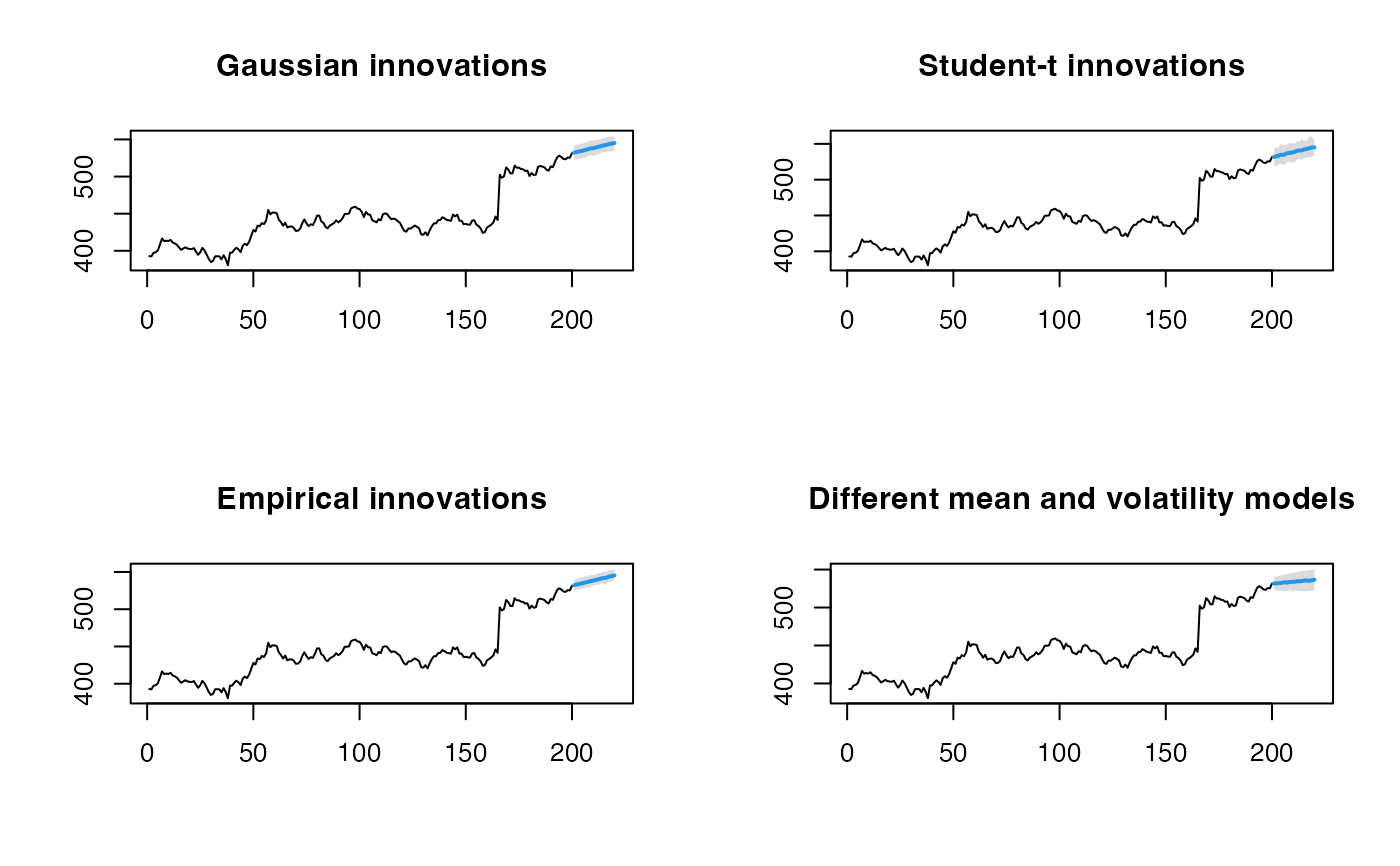
# Compare prediction intervals
par(mfrow = c(2, 2))
plot(fc1, main = "Gaussian innovations")
plot(fc2, main = "Student-t innovations")
plot(fc3, main = "Empirical innovations")
plot(fc4, main = "Different mean and volatility models")
 par(mfrow = c(1, 1))
# }